Saturday, August 30, 2008

UNDERSTANDING ANALYST REPORTS, RATINGS, AND TARGET PRICES

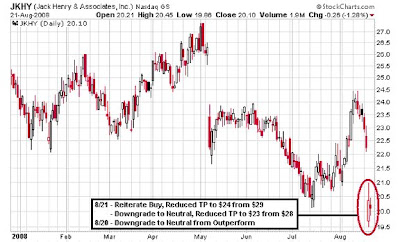
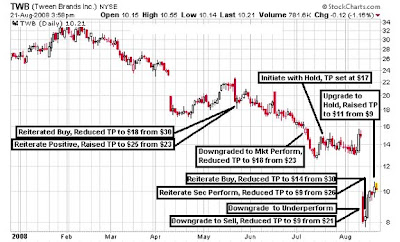
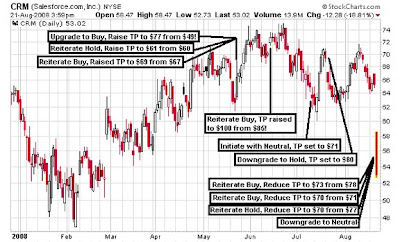
What’s wrong in all of the charts below?


Find a few things odd?

Analysts are paid well over $1 billion every year to write reports on the stocks they cover. Most reports contain a recommendation, earnings estimates, growth estimates, notes on their opinion, a target price, and other fundamental and technical data.

Recommendations or ratings, such as the ones you saw above, are supposed to tell you whether or not you should buy or sell a stock based on an analyst’s research. There are 5 different recommendations: Strong Buy, Buy, Hold, Sell, Strong Sell, with some variation between firms such as Outperform, Market Perform, and Underperform or Overweight, Equal-weight, and Underweight.

Generally, you’ll see a lot more “Buy” ratings than “Sell” ratings due to the fact that analysts are employed by the same investment banks and research firms that do business with the companies that they cover. The last thing a company needs is an analyst crushing their stock (on average 5-10%). Therefore, when an analyst issues a “Hold” rating, it’s really a “Sell” rating in disguise. A downgrade from “Buy” to “Hold” also means “Sell”. When an analyst issues a “Buy” rating that translates into more commission revenue ($$$) for the analysts’ firm. So if you’re an analyst and you want to get paid ($$$), you know what rating to issue.

Many recommendations are inaccurate because they rely on a single person’s opinion of a stock. Since we all have our own opinions, why should we listen to someone else’s, even if they work at ABC investment bank? The charts above show how analysts are “too late” in changing their ratings, inaccurate at setting target prices, and issue the wrong ratings at the wrong time.

An Institutional Investor poll was conducted in 2006 to rank, in the order of importance, what attributes they sought after in sell-side analysts (the guys working at the brokerage firm). The result: Of the 12 attributes, stock picking ranked 11th. This is more evidence that analysts, as whole, are not very good stock pickers. Recommendations should not carry too much weight in an investment decision, and any ratings that are issued over 3 months ago are considered worthless.

How about target prices? They’re worthless too. Basically, analysts create a future earnings projection and add a P/E to these “earnings” based on their opinions. Since future earnings cannot be 100% accurately predicted and the market can sometimes become irrational, what does that make target prices out to be? (Not worth following).

We can also see a phenomenon called “herding”. In general terms, herding refers to “following the crowd”. In the case of ratings, many times if an analyst or two upgrade or downgrade a stock, other analysts are highly likely to follow in that same direction. Therefore, be aware of how many analysts are covering a particular stock and compare that to the most recently issued ratings.

Companies report earnings each quarter. The earnings-per-share (EPS) are the “hard numbers” that are not subject to opinion or manipulation (in most cases). Analysts issue earnings estimates before the release of the actual earnings reported by a company. These estimates are important because they quantify what that particular company is likely to earn in the future. The actual estimates are not nearly as important as the change in the overall consensus.

When analysts revise estimates up or down, analysts that are not close to the estimate range will look stupid, therefore, revising their estimates to join the herd. If all the analysts are wrong in their estimates, then the analyst won’t look so bad, another reason to join the herd. The greater the change in the past 30 days vs. 60 days and 120 days, the stronger the signal to buy or sell occurs, depending upon the direction of the revision.

When looking at the actual earnings report of a company, ask yourself two questions:

  • Where did the earnings come from?
    • Did they come from strong revenue growth, multiple acquisitions, expense cutting, or maybe a few accounting tricks?
    • Did management guide analysts lower but reported much “better”, just to beat analyst expectations?
  • What is the long-term outlook of the company’s future?
    • Did management provide or reiterate guidance for the next quarter and the fiscal year?
    • What new changes are planned to occur with the company?

The response to the stock’s price will be determined depending upon the quality of the answers of the two questions.

On a technical note, the majority of breakaway, continuation, and exhaustion gaps occur when earnings are reported pre-market or after-hours. Area gaps usually occur when an analyst’s rating is issued. Breakaway and continuation gaps have the propensity to continue in the direction of the gap for several months (note gaps in the above charts). This is mostly cause by the large institutions buying or selling the stock throughout the period between when earnings are reported and before the next quarter’s earnings are announced. Area gaps tend to fill quickly, in a matter of days, while an exhaustion gap signals a major longer-term reversal.

In conclusion, it is safe to assume that an investor should not focus on recommendations or price targets, but rather the actual reported earnings, and prior to that, the change in the consensus estimate to determine the most likely future direction of a company’s results.

Friday, August 29, 2008

FUNDAMENTAL FEATURE - Del Monte Foods (DLM)

Rotten Earnings: Del Monte Foods posts Q1 Loss

On Thursday August 28, before the market open, Del Monte Foods Co. (DLM) reported a Q1 loss of $0.05 per share ($0.04 from continuing operations) or $10.1 million on $726.2 million in revenue vs. earnings of $0.02 or $3.5 million on $626.8 million in revenue a year ago. Revenue increased by 15.9% due to price hikes, volume growth, and new products. Discontinued operations added a $0.01 per share loss to the results. Analysts were expecting a loss of $0.03 per share, missing expectations by $0.01 per share. The stock gapped up and opened at $8.98, sold off throughout the day, and closed at $8.60 on 1.83 million shares, up $0.01 from Wednesday’s close of $8.59.

DLM’s Consumer Products division increased sales 20.6% to $383.5 million vs. $317.9 million a year ago. Price hikes and volume growth contributed to the increase; however, the division’s operating income was flat at $9.8 million due to higher costs. The company’s general and administrative (G&A) expenses increased due to “centralization” of marketing and other functions. Headquartered in San Francisco, CA, DLM built a new plant in Pittsburg in 2006, but moved over 100 employees to its headquarters this year. Whether it was necessary or not, if DLM did not move the employees, G&A expenses would not be at $146.1 million, up from $132.8 million a year ago.

DLM’s Pet Products division increased sales 10.9% to $342.7 million vs. $308.9 million a year ago. Again, this was due to price hikes and volume growth. Operating income decreased a whopping 64.9% to $15.4 million from $43.9 million a year ago. After an increase in ingredient costs, marketing and promotion costs reflected the majority of expenses. Instead of showing cute dog barking on their website, they should pay more attention to reducing their expenses if they care to stay afloat in this secular commodities bull market.

In June, DLM announced that they have agreed to sell their seafood business (including the StarKist brand) in Terminal Island, CA and manufacturing businesses in American Samoa and Ecuador to Dongwon, a South Korean conglomerate of seafood, warehousing, distribution, and other businesses. The sale should be completed by the end of Q2.

Due to inflation, the cost of goods sold increased 23.8%, and gains in the company’s top-line were unable to offset the loss. In addition, the DLM’s cash and cash equivalents dropped to $8.6 million, a 66% decrease compared to a year ago. A lack of international exposure is being paid for by the domestic economic slowdown.

Hormel Foods (HRL), Smithfield Foods (SFD), and Sanderson Farms SAFM) demonstrate what kind of impact inflation had on their bottom lines. On August 21, HRL reported earnings of $0.38 per share or $51.9 million vs. $0.41 per share or $57.4 million a year ago, down 9.8%. On August 26, SFD reported a loss of $0.09 per share or $12.6 million vs. earnings of $0.41 per share a year ago. And on the same day, SAFM reported a loss of $0.18 per share or $3.6 million vs. earnings of $1.51 per share or $30.7 million. It’s clear that everyone in the industry is suffering pretty badly, and the recent earnings (losses) prove it. With that said, the industry outlook is negative.

For the full fiscal 2009 year, DLM expects earnings of $0.58 - $0.62 per share. Analysts were looking for $0.57 - $0.58 per share, barely at the very low end of the spectrum. Management expects sales growth of 6-8% for the fiscal year to $3.37 - $3.43 billion, while analysts expected revenue of $3.67 billion. During the fiscal 2008 year, DLM bought back $50 million work of shares (5.37 million shares) under a 3-year $200 million share repurchase plan (Better save that up money first!).

Currently, 9 firms publish recommendations on DLM with 6 “hold” ratings and 3 “sell” ratings. The last rating was on July 16 when Matrix Research downgraded DLM from “Strong Buy” to “Buy”. Since there are 9 analysts, no recent ratings/price target changes, and earnings just came out, expect a few ratings and price target changes to come out soon.

Technically, DLM is down from its recent high of $12.94 on July 13, 2007 and has been drifting down ever since. In May and June, DLM suffered from large one-day drops, sending the stock in a downward spiral. So far, DLM recovered, but on Thursday, it formed a bearish gap up, which is one of my favorite patterns to short. The likelihood of a decline from this point is extremely high. Anyone that wants to short can hold a position till it reaches the 50-day MA at $8.20. Going long is ill-advised.


Full Disclosure: None

FUNDAMENTAL FEATURE - JDS Uniphase (JDSU)

JDSU Breaks Away on Missed Q4 Earnings, Loss Widens

On Wednesday, August 20 after-hours, JDS Uniphase Corp. (JDSU) reported a Q4 loss of $0.13 per share or $29.8 million vs. a loss of $.08 per share or $17.9 million. Revenue increased 11% to $390.3 million from $350.7 million a year ago. Analysts were expecting earnings of $0.10 per share on $395.8 million in revenue. Excluding items, JDSU would have earned $0.07 per share or $15.5 million, missing both analysts’ earnings estimates and the revenue targets. Shares gapped down from yesterday’s close of $11.90, fell over 12% or $1.48, to close at $10.42 on 22 million shares traded.

For the quarter, JDSU’s net income was $15.5 million or $0.07 per share. However, JDSU wrote down $45.4 million of goodwill and intangibles due to two acquisitions, $20.8 million in patent and litigation charges, and a $61.6 million in cash and securities from a litigation settlement. These items lowered net income by $4.6 million. Also, JDSU held $903 million in cash, reduced short-term debt by $75 million and bought back $113.2 million worth of stock. JDSU also announced that the company is free cash flow positive $9 million. To date, JDSU has not released the most current cash flow statement.

For the full fiscal 2008 year, JDSU lost $0.10 per share or $21.7 million on $1.53 billion in revenue vs. a loss of $0.12 per share or $26.3 million in fiscal 2007. Revenue was driven by growth in the optical communications unit (6%), communications test & measurement (12%), and advanced optical technologies (21%). However, the commercial laser unit’s revenue declined by 9%. By geography, The America’s represented 50% of total net revenue, European customers accounted for 29%, and Asian customers accounted for 21%.

Key Figures for Fiscal 2008 (%):

  • Sales Growth: 9.5%
  • EPS Growth: -22%
  • Gross Margins: 42.1%
  • Operating Margin: -8.7%

The industry outlook remains neutral due to a high level of competition and a decline in capital investment. U.S. customers have delayed spending and remain conservative with future purchases. However, due to continued explosive demand in internet media, I expect service providers and telecom carriers to increase network upgrades for the long-term.

Currently 12 analysts publish recommendations on JDSU, which include 6 “Buy” ratings and 6 “Hold” ratings. On August 26, Deutsche Bank Securities reiterated their “Buy” rating, but reduced their target price to $13.50 from $17. On august, 21, RBC Capital Markets reiterated their “Sector Perform” rating, but reduced their target price to $12 from $13. On the same day, Morgan Keegan reiterated their “Market Perform” rating.

For the past 12 months, insiders purchased 0 shares and sold 31,295 shares. Also comparing Q to Q3, there has been a net -27.5% change in institutional ownership, or 35.44 million shares.

For Q1 2009, JDSU expects revenue to be in the range of $378 million - $394 million, which also missed analysts’ expectations of $399.5 million.

Technically, JDSU formed a breakaway gap following Q4 earnings. The stock is threatening to hit a new multi-year low, but I expect a pullback to the $10.50 level as well as a continuation downward for the short-term. JDSU remains in a downtrend since the beginning of 2006 for the long-term and unless JDSU makes a higher low and breaks above $15, long positions should be avoided.


Full Disclosure: None

Thursday, August 28, 2008

INVESTORS/TRADERS GUIDE TO BEAR MARKETS

Perhaps one of my best articles yet. Plain no-bs truth about bear markets...enjoy.

Bear Market: A market condition in which the prices of securities are falling, and widespread pessimism causes the negative sentiment to be self-sustaining. As investors anticipate losses in a bear market, selling continues, which then creates further pessimism. Although figures can vary, for many a downturn of 20% or more in multiple broad market indexes, such as the Dow Jones Industrial Average (DJIA) or Standard & Poor's 500 Index (S&P 500), over at least a two-month period, is considered an entry into a bear market. – Investopedia

As long as humans invest and trade and the laws of supply and demand continue on, we will always have bear markets. They are inevitable. Bear markets form when prices exceed the value perceived by investors and traders and public enthusiasm and greed overtake reason and logical thinking, cause stocks to rise to unsustainable, excessive levels. We saw that in 1999-2000 and we also saw that (to a lesser degree) last year when many companies became overvalued. To understand bear markets, investors must first look at the history of them.

The Colorful History of Bear Markets

Those who cannot learn from history are doomed to repeat it. – George Santayana

*All figures are for the DJIA, except for 2000 (NASDAQ)

This is the 108 year history of bear markets in the U.S. As you can see there’s a bear market, on average, about every 3-5 years. The declines ranged from 15% to 90%. Also note that the 15% is currently for the one we’re in now and although the standard definition of a bear market is “-20% or more”, the DJIA did hit 20% at the July low. Given that ever bear market has exceeded 15%, it is highly, highly likely that the current decline in this bear market will continue. The average duration for a bear market has been around 17-18 months with a wide range of as short as less than 2 months and as long as 56 months.

Ever heard of the phrase, “Stock markets go up a third of the time, down a third of the time, and sideways a third of the time?” That may not be far from the truth. Since 1900 until now, we’ve been in a bear market for 383 months, or 32 years. This means that we’ve been in a bear market for 30% of the time. Pretty close to a third, I’d say.

Secular Bear Markets

History is a guide to navigation in perilous times. History is who we are and why we are the way we are. – David McCullough

Secular bear markets are long-term, typically lasting for 4-20 years. As long as each secondary bull market high and secondary bear market low is lower than the previous ones, then we’re in a secular bear market. The long-downward swings are called primary trends, and the bull markets would be considered counter-trend rallies. We are currently 9 years into a secular bear market.

Historically since 1900, we’ve been in 5 secular bear markets:

  • 1901-1920 (20 years)
  • 1929-1932 (4 years)
  • 1937-1941 (5 years)
  • 1966-1981 (16 years)
  • 2000-Present (9 years)

The Importance of Volume (4 phases)

“Note that bear market cycles begin on reduced volume. As the major downward phase develops, volume increases and this phase ends in a selling climax on heavy volume. The ensuing rally is accompanied by declining volume, which dwindles until the rally loses momentum completely, and the major trend is resumed in a new bear cycle…Bear market rallies start out of active climaxes.” – H.M. Gartley

What he’s say is: In the early stage of a decline, the volume is pretty light. The professionals and the “smart” money are selling, while the public are still asleep. In the second phase, the big money is still selling, and the public starts to unload, but not entirely. The heavy volume that’s present at the third stage is due to a selling climax as now the mass of retail investors are dumping everything that they own creating heavy volume. In the fourth stage, there’s a reaction due to short covering and professional buying, however, the retail investors are still not finished selling, even at the beginning of a rally. Price tends to follow volume, and volume confirms price action.


Secondary Reactions/Counter-trend Moves

“Bear markets seem to be divided into three phases: the first being the abandonment of hopes upon which the uprush of the preceding bull market was predicated; the second being the reflection of the decreased earning power and reduction of dividends; and the third representing distress liquidation of securities which must be sold to meet living expenses. Each of these phases seems to be divided by a secondary reaction which is often erroneously assumed to be the beginning of a bull market.” – Robert Rhea, author of The Dow Theory (1932)

Every bear market has always been made up of 2 or more major downward swings, or primary legs down, and at least 1 secondary reaction between 2 legs. The purpose of the secondary reaction is to correct oversold levels and to reduce speculative activity brought on my new investors. The problem with identifying when a secondary reaction begins is that a primary leg may or may not end on high volume, therefore as with trying to find a bear market bottom, identifying the start of a rally may be difficult. However, when capitulatory volume is present and the market has made a near vertical parabolic move down, then it may signal that the primary leg has ended.

The secondary reactions in most cases take lesser time and may swing with more volatility than the primary leg itself. We are currently in a secondary reaction due to the fact that the price is divergent with volume. As volume declines further, we should see a reversal. Afterwards, we should again see heavy volume resume on the down days.

Another divergent characteristic is the divergence between indices. For example, currently the Russell 2000 and the NASDAQ are performing fairly well, but the DJIA and SPX are getting crushed. Typically, one of the indices reaches a high, but the others are unable to do so. This characterizes “phantom” weakness in the markets that may not be readily visible in the presence of a rally.

A secondary reaction ends as bullish sentiment starts to wane. First, people don’t believe that the rally is ending, but slowly and surely, more and more people start to believe. Once the majority changes their opinions, the next primary downward swing is underway.

The rallies may end at the 50% retracement level, as most people like to believe, however, that’s not true in most cases. These reactions can be as little as 10% or 99.9%, and has history has shown me is that only 7% of reactions end at the 40-55% level. 27% retrace 55-70%, 8% retrace 70-85%, and 14% of secondary reactions retrace past the 85% level. There seems to be this herd mentality that if a secondary reaction goes past the 50% level, these “experts” start to claim a new bull market…


The “V” Bottom These People on TV Are Talking About…

If you're not confused, you're not paying attention. –Tom Peters

When you argue with reality, you lose - but only 100% of the time. –Byron Katie

There is no data on bear markets that formed a “V” bottom that have surpassed a16-17 month bear market duration. For example, the 1929 bear market took 26 years to recover. Since 2000, we have not recovered in the NASDAQ, but we have recovered in the DJIA, only to fall back to the pre-2000 bear market level anyway.

You want to avoid “experts” who just love to forecast where the market is heading. Here’s why:

*Figures are for the DJIA

This is a compilation of Barron’s and BusinessWeek strategists’ forecasts. Notice how they’ve collectively been wrong the entire way down (3 years)? Bottoms are truly verified in hindsight, but until then, ignore the pundits who preach about finding the bottom and believe that we’re still in a bear market. Instead look at a variety of economic, fundamental and technical hard data to help you get close to one.

The End of Bull & Bear Markets

Great is the art of beginning, but greater is the art of ending. – Lazurus Long

Here’s how to tell if a bear market is ending

  • Instead of the price-volume divergence we see in the current rallies, volume actually picks up on rallies and dry up on pullbacks
  • Zero confidence, investor sentiment is at a serious low
  • No good news on the front pages, negative news permeates the media
  • Lack of credit, lack of buying power
  • Real Estate still remains down, commercial properties take a big hit, vacancies high
  • Slight improvements from a feeling of total hopelessness for the market
  • Investors take money out of the market, because they actually need it
  • And many other indicators

Strategies in a Bear Market

I'm not afraid of storms, for I'm learning how to sail my ship. – Louisa May Alcott

  • Learn how to short, and short well
  • Buy stocks that hit capitulation and play the rally
  • If you have to go long, there’s always a market/security that’s going up somewhere in the world
  • Stay in cash, get out of the market, and go on vacation

Monday, August 25, 2008

WEEKLY COMMENTARY - AUGUST 25th-29th

MARKET COMMENTS -- INDU 11,628.06, COMP 2,414.71, SPX 1,292.20, RUT 737.60

The major indices continue to move in a secondary reaction rally. The major difference is that the volume for last week is weaker than the past two weeks’ volume. Notice the down slope in volume as the rally progresses as down days possess more volume activity than the up days in most indices. In addition, the INDU and SPX rallies have both weakened over the past week as they continue to test the 50-day MA. Both indices are in a wedge pattern, which is considered bearish. Friday has marked the 3rd rally attempt for both indices and both most penetrate their short-term recent highs for a continuation. The COMP has tested and failed the 200-day MA in addition to upper resistance around the 2475 level. Notice the tapering of volume is even greater than the previous 2 weeks. Friday’s gap up shows very little enthusiasm and we expect the COMP to test the 200-day MA one or two more times.

(click on chart to enlarge)


All Charts Courtesy of Stockcharts.com
. Copyright ©1999-2008 by StockCharts.com Inc., Redmond Washington. All rights reserved.

The RUT formed a double Adam-and-Adam bottom, entered into a congestion zone mid-July to mid- August, made a new short-term high, met resistance at the 765 area and is now testing the 200-day MA. The RUT must penetrate the June and August highs for the trend to continue in strength. The RUT may trade in a range if resistance levels once again pose a problem. Nonetheless, the RUT is the best performing index shown.

We are now neutral in the short-term of whether or not the rallies will continue in the same initial strength as they did in last month. The reasoning is that volume for the past 3 weeks remain weak and has gotten weaker each week, hitting new short-term lows in volume. This level of “inactivity” is a graphical representation of weak institutional inflow, which is much needed to sustain rallies. We expect a mixed, neutral movement for all four indices for this week. Expect the INDU and the SPX to continue to test the 50-day MA and the COMP to retest the 200-day MA. Again, Volume confirms price action.

ADVANCE-DECLINE (A-D) & NEW HIGHS-NEW LOWS (NH-NL) LINES

The Advance-Decline lines and the New Highs-New Lows lines for the NYSE, NASDAQ (COMP), and AMEX are shown below. The best clues come from any divergences from the indices. The NH-NL line divergence with all indices vs. their respective exchanges continues to widen. Note the continuation of the lines in a neutral or downward trend while the rallies for the indices (and their respective exchanges) continue upward. Also note the A-D lines for each exchange and how the AMEX A-D issues are divergent with the other exchanges.

(click on chart to enlarge)


All Charts Courtesy of Stockcharts.com. Copyright ©1999-2008 by StockCharts.com Inc., Redmond Washington. All rights reserved.

The US Dollar did make a pullback as expected last week; however, we would expect continued consolidation or a deeper pullback at least to the 75 support area. The Euro has also pulled back as expected and we believe the Euro will either trade in a range or resume its downtrend for the short-term. Note 50-day/200-day MA crossovers for both currencies.

THE US DOLLAR/EURO, GOLD/SILVER, OIL/NATURAL GAS

(click on chart to enlarge)


All Charts Courtesy of Stockcharts.com. Copyright ©1999-2008 by StockCharts.com Inc., Redmond Washington. All rights reserved.

Also expected last week, Gold (AMEX: IAU) has pulled back to the 83 resistance area. Silver (AMEX: SLV) has pulled back as well, but did not fill the previous gap. We expect both commodities to trade in a range for the short-term. Also note the imminent 50-day/200-day MA crossovers.

Oil (AMEX: USO) spiked on Thursday due to a decline in the US Dollar as well as Russia’s presence near Georgia’s two main pipelines. We expect the USO to trade in a range bound by the 50-day MA and the 200-day MA. Natural Gas (AMEX: UNG) continues to slide in a downtrend, and we expect that to continue, but also expect a sharp spike away from extremely oversold levels.

AFTER EARNINGS REVIEW

(click on chart to enlarge)

All Charts Courtesy of Stockcharts.com
. Copyright ©1999-2008 by StockCharts.com Inc., Redmond Washington. All rights reserved.

ADI – Reported earnings of $0.44 per share from continuing operations, missing analysts’ expectations of $0.45 per share. Q3 income rose to 4138.6 million vs. 120.4 million a year ago. Revenue rose 7% to $659 million, practically in-line with analysts’ expectations of $658.9 million. Shares opened at $31.14 and drifted down throughout the day to close at $29.29, down 9% on 11 million shares traded.

FMD – Reported a loss of $0.53 per share due to a continued weakening in the student loan market and a decline in the value of receivables vs. positive earnings of $0.83 per share a year ago. Analysts expected an average loss of $0.53 per share, missing expectations. Revenue dropped to a loss of $40.4 million vs. a gain of $197.1 million a year ago. Shares closed Friday at $3.67, up $0.06.

BJ – Reported $0.61 per share on $2.65 billion in revenue vs. $0.55 per share on $2.25 billion in revenue a year ago. Analysts expected $0.57 per share on $2.67 billion in revenue, beating earnings estimates but missing revenue targets. Shares dropped 7% to close at $37.71.

HPQ – Reported $0.80 per share or $2 billion on $28 billion in revenue. Excluding one-time items, HPQ would have earned $0.86 per share, beating estimates of $0.83 per share. The company also raised its Q4 outlook by announcing that it expects to earn between $0.95 - $0.97 per share. Shares rose 6% to $46.16 on 33.1 million shares.

(click on chart to enlarge)

All Charts Courtesy of Stockcharts.com. Copyright ©1999-2008 by StockCharts.com Inc., Redmond Washington. All rights reserved.

CTRN – Reported earnings of $0.20 per share, beating estimates of $0.17 per share by analysts. Revenue rose 16% to $338 million. The company also reiterated its guidance for the fiscal year. Shares rose $1.81 or 10% to close at $20.26. Shares the previous day dropped 11%.

PERY – Reported a loss of $0.36 per share or negative $5.4 million vs. net income of $267,000 or $0.02 per share a year ago. Analysts expected PERY to report a loss of $0.02 per share, widely missing expectations. Shares got crushed, dropping 25% or $5.77 to close at $17.23.

JDSU – Reported a loss of $29.8 million or $0.13 per share vs. a loss of $17.9 million or $0.08 per share a year ago. The loss was due to heavy acquisition-related charges. Shares fell 12% to $10.42, down $1.55 on 22 million shares traded.

NVTL – Reported preliminary results and expected to earn $0.03 per share for Q2 or $25,000 vs. $8 million or $0.25 per share a year ago. Analysts were expecting $0.14 per share, entirely missing expectations. NVTL expects a loss for Q3 of $0.03 per share while analysts were expecting earnings of $0.18 per share causing analysts to revise all estimates for the remainder of the fiscal year. Due to a delay, NVTL received notice from NASDAQ for failure to file its 10-Q and may be delisted if unable to meet listing requirements. Shares fell $2.11 or 25% to close at $6.29 on 7.2 million shares.

SELECTED INDUSTRY GROUPS

(click on chart to enlarge)


All Charts Courtesy of Stockcharts.com. Copyright ©1999-2008 by StockCharts.com Inc., Redmond Washington. All rights reserved.


This Week’s Watch:

  • The DJIA and SPX will continue to test the 50-day MA, the COMP will continue to test the 200-day MA. The RUT may re-test its June high. Note any increases in volume (if any) on positive days during the current rally.
  • Several COMP industries are bound between the 50-day and 200-day MA’s. Note any breakouts or breakdowns.
  • Numerous retails will report earnings this week as well. Last week, retailers mostly reported negative earnings. Make note of both positive and negative reports.

Economic Reports of interest: Mon. (Existing Home Sales), Tues. (S&P/Case Shiller Home Price Index, Consumer Confidence, New Home Sales, House Price Index, Richmond Fed Manufacturing Index, Weekly Retail Sales), Wed. (Weekly MBA Mortgage Applications, Durable Goods Orders), Thurs. Prelim Q2 GDP, Prelim Q2 Personal Consumption, Prelim Q2 GDP Price Index, Initial Jobless Claims), Fri. (Personal Income, Personal Spending, PCE Core, University of Michigan Consumer Confidence).

Noteworthy Earnings Reports: Tues. (COCO, SFD, BGP, CHS, JCG, AEO, BIG), Wed. (BWS, MW, DLTR, TLB), Thurs. (WSM, SHLD, ENER, ZLC, NOVL, MCRS, PETM, OVTI, GCO, DELL, TIF, DLM, FRED).

Contact: John C. Lee // E-mail: JCLee84@hotmail.com // Website: www.WeeklyTA.blogspot.com

*For fundamental-related articles, please visit: http://seekingalpha.com/author/john-c-lee

FUNDAMENTAL FEATURE - Syneron (ELOS)

Syneron’s Superb Q2 Treatment

Writing about Syneron (ELOS) brings back fond memories. My first trade in ELOS was nearly 4 years ago on 10/19/2004 for 100 shares at $20.48. I sold the shares 2 weeks later at $26.861 for a 31.15% return, banking a profit of $638.10 (woo hoo!). In 2004-2005, shares wildly swung $1-$2 intraday, multiple times a week (but not anymore). ELOS was the perfect very short-term trade, giving me the opportunity to trade ELOS 18 times in the next 12-months. Those were the days.

On Thursday, August 14 before the market open, ELOS reported Q2 ’08 earnings of $0.40 per share or $11 million (7% higher) on $38.2 million in revenue vs. $0.37 per share or $10.3 million a year ago. Excluding compensation (stock-based), ELOS earned $13.7 million or $0.50 per share. Analysts expected $0.32 per share (excluding items, including compensation) on $37.1-$37.6 million in revenue, beating both earnings and revenue targets.

This was primarily fueled by an increase of 17% in international sales to $19.1 million. International and U.S. sales each account for 50% of total revenues. ELOS increased its cash position by 5% to $220.6 million while reducing marketing expenses by 10% to $14.3 million. What I love about ELOS, and also CLZR and CUTR, is that they all have zero debt.

Shares reacted in the morning by gapping up $0.74, opening at $16.52, hitting a high of $17.25 and selling off throughout the day to close at $15.89, or up $0.11.

ELOS was able to capture 15% of the non-aesthetic medical market within 4 years (Currently at over 20%) and its installed platforms now number over 6,000 units worldwide. The company’s elōs™ technology combines bi-polar RF and optical energy (lasers) for cosmetic treatments including fat reduction, skin whitening, tightening and rejuvenation, wrinkle reduction, leg veins, and other non-invasive treatments. Headquartered in Israel, they have global headquarters in the US, Canada, Germany, and Hong Kong.

LipoLite™, a fat-reduction device, was launched at the end of the quarter and management expects significant sales from the device. ELOS also implemented LEAP (LipoLite Energy Access Program) which is a cost-effective annual subscription (fee: $30,000) offered to all physicians to take advantage of using the device for lipolysis treatment. This program is favorable to physicians as it decreases upfront costs and the risks associated with a long-term lease lock-up period.

Despite economic conditions in the U.S., I still expect ELOS to benefit from an increasing global demand in healthcare, meeting the needs of physicians for non-invasive technology, an increasing population of persons 55 years and older, and a solid high-end patient base. ELOS commands the largest market cap ($438.8 million) among competitors as well as the highest percentage return on revenue (22%) within the medical laser sector.

Currently, 2 “Buy” ratings and 4 “Hold” ratings are recommended by the 6 analysts that publish reports on ELOS. In the past 3 months, there has been a +6.7% net change in institutional ownership with a net 1.94 million shares purchased.

Technically, ELOS is sitting near all-time lows since the IPO in 2004. For the past 10 months, ELOS has been trading in a neutral range of $13-$18. A breakout above $18 is considered bullish and confirms a new uptrend, while a breakdown below $13 suggests a continuation down. The MACD indicates a bullish trend, while the RSI is neutral. Sitting above both the 50-day and 200-day MA, ELOS is in a better position to breakout, but still remains in a neutral range.


Full Disclosure: None

www.seekingalpha.com/author/john-c-lee