Saturday, January 24, 2009

TODAY'S ACTION

This week was probably the most volatile up-down, down-up type of week in over a month. Volatility isn't just about downside movement in the market. I'm talking about massive swings in both directions where it would be nearly impossible for both bulls and bears to make a decent profit if they were to hold for longer than a day. If you survived this week, congratulations. That is an accomplishment of it's own.

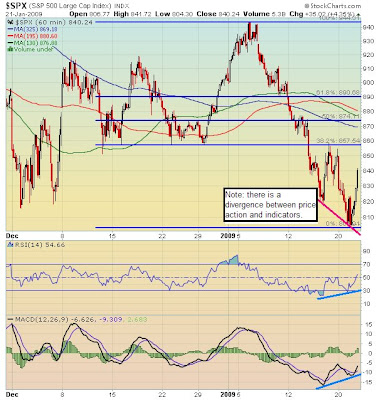
Let's take a look at the SPY for a moment (CLICK to enlarge)


1) Moving Averages
-a) 325-period (blue) = 50-day SMA, resistance
-b) 195-period (red) = 30-day SMA, resistance
-c) 130-period (green) = 20-day SMA, resistance
-d) 65-period (pink) = 10-day SMA, resistance
-e) 32.5-period (purple) = 5-day SMA, support

2) Solid green line is intermediate resistance & upper line segment of a symmetrical triangle.

3) Solid sky blue lines at 80.50 and 84 mark the neutral channel (or 805-840 on the SPX).

4) Ascending lower line segments for the symmetrical triangle. Two meeting points, one at 81 and the other at 82.75. Both have been used as support for the past 3 days.

5) Notice the volume spikes on the way down for both positive and negative days in the "blue zone" (75M or more shares or more).

Finally, the various selected indicators below the SPY show an obvious divergence that is positive for the market when using the neutral channel (3). We've gapped down and rebounded for 3 consecutive days on stable volume. I do not know when, but it looks like the market may be setting up for a short-term bounce. I've covered the vast majority of my positions and added some long positions, including oil via DXO (I never trade oil), and hold a large cash position.

My rule right now is to not hold much overnight because 1) we are still in earnings season, 2) this market is once again emotionally-charged and news driven, 3) the uncertainty of the financials doesn't give me much comfort (more immediate bailouts on the way?), 4) overhead resistance, 5) the downtrending sell-off has been halted, 6) the past two days' candles are forming long shadows, or tails (typically bullish), and 7) "WTF" chart patterns have been appearing in the morning, mid-day, and/or end of day, causing extreme whipsaw and headache to traders everywhere.

As you can see, there are too many mixed signals that will kill both bulls and bears if you are not hedged or have an ample cash reserve. There's no rush right now, and I'm not going to rush it. The key right now is capital preservation.

That's all for now. gtg!

Today's Spread Trade Action

Today, an increasingly popular way to grow money is with spread trading. Spread trading allows a trader to profit from both increasing and decreasing moves on a variety of international markets including stock indexes, individual shares, currencies, bonds, and commodities. Profits are 100% tax free!

Friday, January 23, 2009

YESTERDAY'S ACTION

I just woke up to find the futures in the red like whoa. I'm not sure if the bulls can take this stress. Are you one of the a-hole dip buyers buying in a downtrend? I am ready to do some serious damage today while you go around selling your shit.

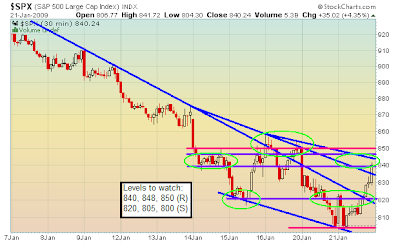
Key levels: 812 --> 805 --> 800, 838 (resistance)

Also note triangle in 5, 10 day charts. It will break immediately at the open.

Have a nice day.


Don't forget to try the Free Trend Analysis. It's FREE, so give it a shot!

Wednesday, January 21, 2009

TODAY'S ACTION


Wow, that ride down ended quick. Really quick, at least temporarily. I would have gotten my face ripped off today if it weren't for my program auto-buying FAS in increments. I realize that the market is becoming more volatile with multi-percentage days, just as it did back in September, but is that a good thing or a bad thing? This is why it's so important to be flexible. It doesn't matter what you think...if the market thinks otherwise.

What today showed me is that there are too many things, both visible and invisible, that are propping up this market. In addition, the news flow EOD today was incredibly positive and the anticipated decline will have to be placed on hold pending a possible gap up tomorrow in response to AAPL earnings and desperate bank executives buying up shares to prop up their own stocks. (Didn't Pandit do this in November?). It's a confidence move and it's working, at least in the short-run.

As for price action, today's gains nearly cancelled out yesterday's losses and the volume is being maintained. Obviously, the bears could not follow through, suggesting that it's not quite time for an Armageddon-style cliff jump. I would like to see a stick sandwich, thank you very much.
It is possible that the financials could become those 'Spikers' that I always talk about, giving me the opportunity tomorrow to recover the hit I took on the gains made yesterday. The way that works is that it's not always a long opportunity, but a short one as well. I posted it here before, so I'm going to go around looking for it.

I think 99% of traders would not be able to withstand the joy ride that goes on in my portfolio. To give you an example, I was up (YTD) around +21% on Friday, +64% on Tuesday, and I now stand at +52%. The daily change is a reminder of an ex-girlfriend that PMSed on you - sometimes she loved you, sometimes she just wanted to kill you. But I can handle that.

Let's see what tomorrow brings. Currently, I am hedged and willing to stick with a short bias IF the market action indicates further downside continuation, but I'm currently more inclined to preserve my ridiculous January gains. At this point, some financials look like they will spike higher and some do not, giving me mixed signals. Another thing to look for is if they lead the market right out of the gate tomorrow. This will all be looked into further.

I also see that the "haters" have re-emerged from their cave. lol, please. Make note that I never had a down month in over 2 years, Madoff-style. You can kindly suckle on that till it bursts on your face. Have a good night!

TODAY'S ACTION


Yes, We Can...drop -332 points! heh heh...congrats to our new President. I would have gone to the Mall, which is only minutes away, but decided not to because 1) I had a good amount of money at work since Friday, 2) it's 20 degrees in DC these days, 3) I had to coach my students, who also made profits on a shitstorm day. Besides, why not watch the Inaguration on your favorite financial network in your heated office? Exactly.


What's great about charts is that sometimes you know immediately when you are right or wrong and if you should add or reduce positions. Today was one of those days. I'm not going to bs: I was slightly questioning my decision to hold my short positions on Friday. That was normal given the power rally that occurred end of day. The rewards for those who held shorts over the long weekend were immediately realized and it was a major day to make a killing. I am personally up a ridiculously large amount and I regularly use the same charts I post here for intraday guidance.

What do I mean by guidance? The first things you should note are the key support/resistance levels, any moving averages or fibs (if any), and price/volume action. When you are trading the next day, you should be keen enough to discover that these "magical" lines and stuff actually do work, despite that fact that I just made TA sound like Tasseography. Sometimes, in the heat of battle, it's easy to forget the key technical levels because emotions are running so high. This is why I encourage people to actually write this stuff out. It only takes a few seconds and it could save you thousands of dollars.

Today was an important day. I needed the market to close in the red to support my short bias. I didn't need a -5% down day, but I'm not complaining. We took out the key levels I mentioned yesterday, especially 820 SPX. The Dow broke and closed below the 8,000 level. This level is not necesarily a major technical level, but it's more of a psychological level (remember when we broke 10,000? Pure chaos). The COMP and R2K both failed the 50-day MA and all 4 indices are in comfirmed downtrends. There is no reason to be an a-hole dip buyer here.

For weeks now, I've told you guys to observe the financials, the weakest sector in the S&P. They made a new low today and they won't hesitate to bring the indices back down to test their own respective lows. The only time where someone should be long in this situation is if the financials stem the decline with capitulation and rally on a highly reliable reversal on massive volume. Until then, the bleeding will continue as the fear continues to permeate the markets and people sell stocks like it's going out of style.

Right now, I'm going to ride this downtrend until the wheels fall off regardless of whatever small bounces occur during this descent. I am up +64% YTD thanks to 1) going long spikers, 2) going short financials, and 3) my tea leaf readings.

In other news, this idiot finally quit.


SPX 3-day

SPX 5-day

SPX 10-day

SPX 50-day

SPX 4-month

XLF
Don't forget to try the Free Trend Analysis. It's FREE, so give it a shot!

Monday, January 19, 2009

A WORD ON RETAILERS AND COMMERCIAL RE IN NYC...AND BAC

Just came back from NYC for a weekend vacation, but like any serious investor/trader, I had to do some walking around to see the extent of the damage in NYC. I saw firsthand the awfulness of retail and commercial RE and anyone that knows NYC can clearly tell the difference. In addition, a BAC trader friend of mine and I went to the new $1 billion BAC NYC headquarters in front of Bryant Park and also took a look at the excess and extravagance that you, the taxpayers, are now supporting (and not by choice). It's sickening how there isn't a limit to luxurious spending even after accepting a bailout.

BAC also just stopped issuing Styrofoam, plastic spoons, and other cheap cutlery to "help the environment by reducing non-biodegradeable waste". Hold up. When I was up on the trading floor, there were 3-4 people up there (including my friend and I), and every single desk's CNBC and every ceiling light was on. I even saw some traders stashing away plastic spoons in their bottom drawers. News is that 80-90% of BAC traders will get laid off, with decisions as early as this Friday. They will all be replaced by the Merrill traders (even though those guys took huge trading losses!).

Charts are perfect representations of the struggles of human emotion. However, if you get so immersed into charts and that's all you use (like I do), then you slowly get disconnected from reality, disconnected from what's truly happening beyond the chart. It is good to actually go out there and see what's going on. What I found supports the case for massive upcoming retail and commerical RE liquidations. It is inevitable. No joke - there's at least one vacancy on every block in Midtown. We're talking about prime real estate and this is only the beginning.

As for retailers, I saw more employees than customers in at least 80% of the stores. I'm talking about 5th Ave, the "throw away your money" capital of the world. The employees were getting paid to talk to each, basically. Also, I told my friend to "Look at the Hands!". That's right. Are they holding anything...a shopping bag, perhaps? Nope. This was on a Sunday afternoon and people were not shopping. I could tell it was a disaster and yes, there were plenty of out-of-business signs. If Fifth Ave is the symbol of wealth in NYC, then the pictures below show not only the present, but the future as well.

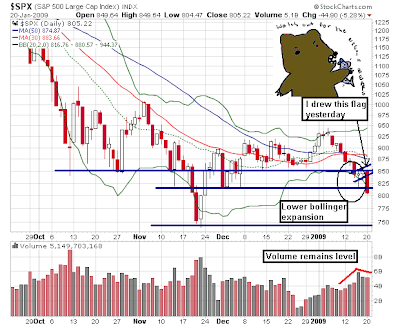
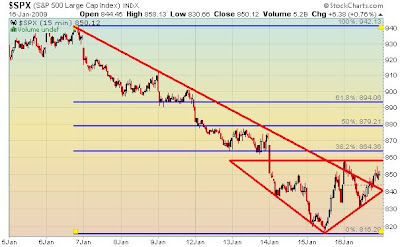
First, the usual charts. They will be important tomorrow as the financials get destroyed (thanks to RBS, and of course HBC, BCS, and LYG). Make note of the marked support levels. 834 (SPX) is the initial support level, followed by 830, and finally 820. There's a good amount of support, but if the market undercuts 820, we could have some major problems. The financials are still in focus, don't take your eyes off of them.


Next, BAC's extravagant NYC HQ, now being partially funded by taxpayers (the extra $20 billion is going to the building either directly or indirectly...don't think that it isn't):

Lobby

Conference Lounge

These walls actually change color during the day (currently red). Ridiculous.

Do you need a jungle in your office? I didn't think so.

They have the space age waterless urinals!


The trading floor that's about to be slightly less occupied. Someone please turn off the TVs and the lights.

Finally, retailers and commercial real estate in NYC. I can't fake these pictures. They are very real:

Even Elmo and the Cookie Monster are out of work.


Side-by-side vacant stores on Fifth Ave.

No, they're NOT moving in.

This last one is right in the heart of Times Square!

*FYI - All of the above pics were taken in Midtown Manhattan, not South Bronx.

Here's some useful data (courtesy of SB):


If you want to laugh after reading this depressing post, I recommend Dangerfield's Comedy Club between 61st & 62nd Sts.


Don't forget to try the Free Trend Analysis. It's FREE, so give it a shot!