Saturday, November 8, 2008
WEEKLY ECONOMIC REVIEW (11/03 - 11/07)
The economic picture of the U.S. this week was terrible, and that’s an understatement. Just like charts for stocks, charts for economic indicators paint a very clear picture. Many charts have gone nearly parabolic, but that doesn’t mean the trend ends here. Looking at the big picture, it is obvious that the economy will get worse. There is no question about it. Although the stock market does rally ahead of an economic recovery, the economy is nowhere near a point of recovery. Here’s a simple review of this week’s economic indicators:
Motor Vehicle Sales
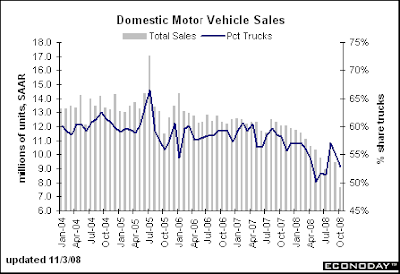
The consensus (m/m/ change) for motor vehicle sales was 9.2 million within a range of 8.4 to 9.6 million. The previous actual reading was 9.4 million. On Monday, the reading declined to 7.7 million. Automakers know this, so why do they keep on making cars that no one wants to drive and then go to Washington and beg for money?
Construction Spending
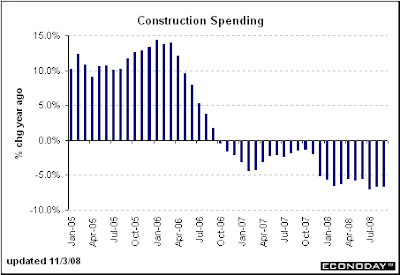
The consensus (m/m change) for construction spending was -0.8% within a range of -1.5% to -0.2%. The previous actual reading was 0%. On Monday, the reading came in at -0.3% “better” than expected. Looking at the chart, there is nothing better about it. As long as credit remains tight and banks refuse to lend, expect no “rebound” from these levels.
ISM Manufacturing Index
The consensus (m/m change) for the ISM Manufacturing Index was 41.5 within a range of 37.8 to 48.5. The previous actual reading was 43.5. On Monday, the reading came in at 38.9. Obviously, by looking at the chart, you can see that it fell off a cliff. These are the lowest readings since the 1980s and I have a strong feeling that it’ll be lower.

Challenger Job-Cut Report
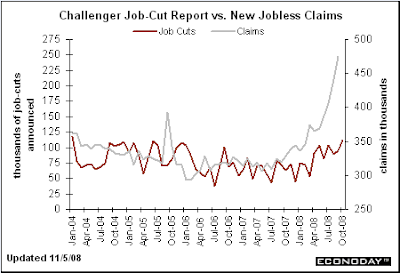
The reason why the Challenger report is so important is because it foreshadows what the Employment Situation report will bring. The previous reading for announced layoffs on the Challenger report was 95,094 in September. On Wednesdays, the October report showed a reading of 112,884 announced layoffs, mostly in the financial and auto sectors (no surprise!). Given how the month started off. November’s report should be even worse.
ADP Employment Report
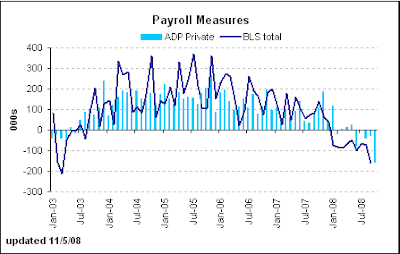
A double whammy on Wednesday, the ADP report confirmed what the Challenger report presented: we are losing lots and lots of jobs. The previous reading for September (m/m difference) was -8,000. On Wednesday, the reading for October came in at -157,000, a huge month-to-month difference, but expected.
Motor Vehicle Sales
The consensus (m/m/ change) for motor vehicle sales was 9.2 million within a range of 8.4 to 9.6 million. The previous actual reading was 9.4 million. On Monday, the reading declined to 7.7 million. Automakers know this, so why do they keep on making cars that no one wants to drive and then go to Washington and beg for money?
Construction Spending
The consensus (m/m change) for construction spending was -0.8% within a range of -1.5% to -0.2%. The previous actual reading was 0%. On Monday, the reading came in at -0.3% “better” than expected. Looking at the chart, there is nothing better about it. As long as credit remains tight and banks refuse to lend, expect no “rebound” from these levels.
ISM Manufacturing Index
The consensus (m/m change) for the ISM Manufacturing Index was 41.5 within a range of 37.8 to 48.5. The previous actual reading was 43.5. On Monday, the reading came in at 38.9. Obviously, by looking at the chart, you can see that it fell off a cliff. These are the lowest readings since the 1980s and I have a strong feeling that it’ll be lower.
Challenger Job-Cut Report
The reason why the Challenger report is so important is because it foreshadows what the Employment Situation report will bring. The previous reading for announced layoffs on the Challenger report was 95,094 in September. On Wednesdays, the October report showed a reading of 112,884 announced layoffs, mostly in the financial and auto sectors (no surprise!). Given how the month started off. November’s report should be even worse.
ADP Employment Report
A double whammy on Wednesday, the ADP report confirmed what the Challenger report presented: we are losing lots and lots of jobs. The previous reading for September (m/m difference) was -8,000. On Wednesday, the reading for October came in at -157,000, a huge month-to-month difference, but expected.
ISM Non-Manufacturing Index
The consensus (m/m change) for the ISM Non-manufacturing Index was 47.5 within a range of 42 to 50.5. The previous actual reading was 50.2. On Wednesday, the reading came in at 44.4. The biggest drop was a result of the employment segment of the index (a -3 point drop). This is a record drop. This resulted in a sell-off in the USD and a move into Treasuries.

Jobless Claims
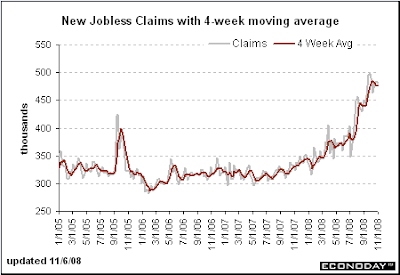
The consensus (weekly) for Jobless Claims was 480K within a range of 460K to 500K. The previous actual reading was 479K. On Thursday, the reading came in at 481K. The total comes in at 3.843 million claims for a 25-year high. Below, the chart looks almost like the VIX during its meteoric rise and it looks like it has more room to go.
The Employment Situation (Nonfarm Payrolls, Unemployment Rate)
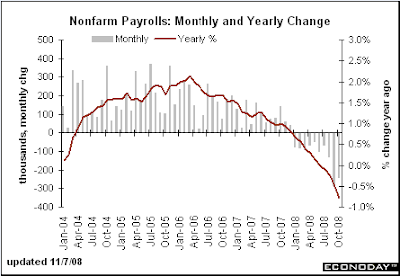
The consensus for Nonfarm Payrolls (m/m change) was -200K within a range of -250K to -85K (whoever thought -85K should be fired). The previous actual reading was -159K. On Friday, the reading came in at -240K, worse than expected, but then again, Wall Street expected worse. The consensus for the Unemployment rate was 6.3% within a range of 6.2%-6.5%. The previous actual reading was 6.1%. On Friday, the reading came in at 6.5%, or the high end of consensus. November should be a very disappointing report because there is obviously nothing that can change the grim picture a month from now.
The consensus (m/m change) for the ISM Non-manufacturing Index was 47.5 within a range of 42 to 50.5. The previous actual reading was 50.2. On Wednesday, the reading came in at 44.4. The biggest drop was a result of the employment segment of the index (a -3 point drop). This is a record drop. This resulted in a sell-off in the USD and a move into Treasuries.
Jobless Claims
The consensus (weekly) for Jobless Claims was 480K within a range of 460K to 500K. The previous actual reading was 479K. On Thursday, the reading came in at 481K. The total comes in at 3.843 million claims for a 25-year high. Below, the chart looks almost like the VIX during its meteoric rise and it looks like it has more room to go.
The Employment Situation (Nonfarm Payrolls, Unemployment Rate)
The consensus for Nonfarm Payrolls (m/m change) was -200K within a range of -250K to -85K (whoever thought -85K should be fired). The previous actual reading was -159K. On Friday, the reading came in at -240K, worse than expected, but then again, Wall Street expected worse. The consensus for the Unemployment rate was 6.3% within a range of 6.2%-6.5%. The previous actual reading was 6.1%. On Friday, the reading came in at 6.5%, or the high end of consensus. November should be a very disappointing report because there is obviously nothing that can change the grim picture a month from now.
Labels:
Economics
FRIDAY'S ACTION
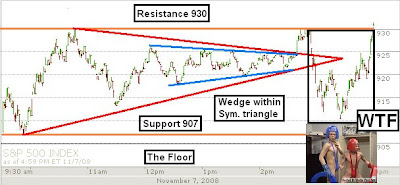
We're in a flag formation which is much expected after a -10% move down. Friday was an interesting day where we just zigzagged up and down forming a triangle for most of the day. And yes, we did have another WTF moment in the last hour of trading. I can almost say that the spike in the last half-hour was due to program short-covering because the volume just didn't convince me that it was real buying. If we do not breakout from this flag, then this is a bearish continuation straight down to test the lows.
Friday, November 7, 2008
THURSDAY'S BREAKOUTS & BREAKDOWNS
We tested the 20-day MA and failed. We failed from the beginning and just sliced through the support level like a hot knife through butter. Many stocks are still above their half way point from the start of the rally to the peak. Even breadth is doing well. We had 15 new highs (an incredible feat) and 296 new lows (not bad at all). This suggests that the vast majority of stocks are within a range. This was especially true due to my inability to find a large number of breakouts or breakdowns worth profiling the past few days. The employment situation report coming out today will definitely set the tone for the rest of the day.
 There are two stocks that I want to mention (PETS, QCOR). These two are out of a small handful that have persevered in this bear market and have maintained their uptrend for months. And like before, we’ll use this time to see how certain breakdowns could have been prevented (of if you’re short, what to look out for).
Thursday, November 6, 2008
TODAY'S ACTION
Prepare for tomorrow, because there are only two options:
#1 - We form a double-bottom right off the 900 level, despite the terrible Employment Situation report and we head up to at least 20-day MA resistance. The VIX fails the 20-day MA resistance and falls back towards the 50-day MA.
#2 - We break 900 and we automatically head straight to 840-850 where the last support level is located before we make a new low. 900 appears to be a strong support area, but then again, fear is just as strong.

#1 - We form a double-bottom right off the 900 level, despite the terrible Employment Situation report and we head up to at least 20-day MA resistance. The VIX fails the 20-day MA resistance and falls back towards the 50-day MA.
-or-
#2 - We break 900 and we automatically head straight to 840-850 where the last support level is located before we make a new low. 900 appears to be a strong support area, but then again, fear is just as strong.
The Employment Situation report: 8:30AM EST

Labels:
SPX
MARKET CARPET
B-L-O-O-D B-A-T-H
Subscribers received an e-mail this morning at 9:33AM to go 75% short/25% cash. Another e-mail sent at 10:43AM notifying subscribers to go 100% short. Subscribers receive a recommendation for a partial scale out of short positions. A bit early to cover, but we still made bank. Better than being long. Therefore, I'm up over 11% for the week.
Bottom line: if you went long, your portfolio looked like this:
Labels:
Market Carpet
VIX UPDATE
On a longer short-term scale, this appears to be only a reactionary/secondary rally. We've already broken down days ago. 20-day MA is now the primary area of resistance and the short-term initial target.
Labels:
VIX
Wednesday, November 5, 2008
TODAY'S ACTION
Well, I was in majority cash yesterday so I didn't feel the bite. I'm ready to go long again once we hit the 20-day SMA. Any break from that level, then it's 100% short for me. We gapped down today, but it was only -100 pts on the Dow, initially, and the fact that we weren't able to fill the gap in the first 30 mins was a big warning sign. I asked my coaching students to stay in cash this morning and for good reason - the market appeared weak and needed a rest. That doesn't sound too technical, but that's how it was and you can call it whatever you like.
The major break came at around 982-983 on the SPX. After that, we formed a bearish continuation flag for 4 hours until we once again broke down. The people holding here are the ones that only "hope", but it doesn't make sense to "hope" when you're in a bearish continuation pattern, does it? Then, the market sold off rapidly in the last hour of trading. No one should be surprised about that - we were already in a downtrend since the beginning of the day.
Tomorrow, pay attention to all the short-term 20-day SMA support levels. It may be an opportunity to buy up, or in case of failure, to short like crazy. We have a slew of economic reports, so keep your eyes on those.
Labels:
SPX
MARKET CARPET
BLOOD!!!
My premium newsletter subscribers avoided the bloodbath. I sent an e-mail YESTERDAY at 11:37AM to sell out of 75% OR MORE of their holdings. Another e-mail sent TODAY at 9:47AM to sell out of EVERYTHING. So, if any stupid retard idiots made a nonsense comment about my "market timing" abilities, well, there's your answer. Oh, by the way, I'm up 8.3% for this month after being up 61.4% in Oct. and 27.6% in Sept., so you can suck it big time and stfu.
My premium newsletter subscribers avoided the bloodbath. I sent an e-mail YESTERDAY at 11:37AM to sell out of 75% OR MORE of their holdings. Another e-mail sent TODAY at 9:47AM to sell out of EVERYTHING. So, if any stupid retard idiots made a nonsense comment about my "market timing" abilities, well, there's your answer. Oh, by the way, I'm up 8.3% for this month after being up 61.4% in Oct. and 27.6% in Sept., so you can suck it big time and stfu.
Labels:
Market Carpet
APRIL FOOLS MUST'VE COME EARLY
Is this a joke? Hiring a Chief RISK Officer of a FAILED i-BANK to Advise on BANK supervision? They couldn't find ANYONE else?
NEW YORK, Nov 4 (Reuters) - The Federal Reserve Bank of New York has hired the former chief risk officer of Bear Stearns Cos, Michael Alix, to advise on bank supervision, according to a release in the Fed's Web site.
Alix will serve as a senior advisor to William Rutledge in the Bank Supervision Group and his appointment is effective Nov. 3, according to the release dated Oct. 31
At Bear Stearns, an investment bank that collapsed in March and has become hallmark of the global credit crisis, Alix served as chief risk officer from 2006 to 2008 and global head of credit risk management from 1996 to 2006.
Before that, he spent eight years at Merrill Lynch & Company
Labels:
WTF
Tuesday, November 4, 2008
TODAY'S BREAKOUTS
Yes, we are in a confirmed rally, but this is only a reactionary rally. This means, enjoy the rally while it lasts before I jump on the short wagon. I am still long with a few short positions mixed in, but in 75% cash ahead of the elections. I’d rather sell out and trade the reaction than holding during the “news”.
I’m profiling breakouts and a lot of my comments may be obvious, but that’s not the point. The point is to recognize the key resistance area that will be soon approaching for 80-90% of stocks, and that is the 50-day MA. Other stocks that broke out above the 50-day will use the moving average as support. Short-term traders should take profits before resistance is hit. Watch the 50-day MA’s closely and just be cautious.


I’m profiling breakouts and a lot of my comments may be obvious, but that’s not the point. The point is to recognize the key resistance area that will be soon approaching for 80-90% of stocks, and that is the 50-day MA. Other stocks that broke out above the 50-day will use the moving average as support. Short-term traders should take profits before resistance is hit. Watch the 50-day MA’s closely and just be cautious.


Subscribe to:
Posts (Atom)
